
Failover decides a link is down using a small daemon called dpinger, which fires roughly one probe per second at a target through each WAN and watches two numbers: packet loss and latency. When either crosses a threshold you set, the gateway is marked down and traffic reroutes. Get those thresholds and the monitor target right and failover is invisible; get them wrong and your network flaps every time a single ping goes missing.
This is the piece of a multi-WAN build that people configure once, never understand, and then blame when things go sideways. I did exactly that at first. On my OPNsense box the whole failover mechanism hinges on dpinger, and once I actually learned what each field does, the difference between “failover works” and “failover is a nightmare” turned out to be about four settings and one good decision about where to point the probes.
If you have not built the failover group yet, start with the OPNsense multi-WAN failover setup and come back here to tune it — this article is the “why” behind the monitor IP and threshold fields on that screen. For the wider picture of where monitoring fits, the multi-WAN overview maps the whole territory.
What Is dpinger and What Does It Actually Do?
dpinger is a lightweight monitoring daemon that both OPNsense and pfSense use to track gateway health. It sends ICMP echo probes to a target IP through a specific WAN at a fixed interval — by default about one per second — and continuously computes the average latency and the packet-loss percentage over a rolling window. Those two live numbers are what the firewall consults to decide whether a gateway is usable.
It is deliberately simple, and that is a virtue. dpinger does one job — measure loss and latency per gateway — and does it with almost no overhead, which is exactly what you want from something running forever on a fanless box. The dpinger project on GitHub documents the underlying options if you want the raw mechanics. In OPNsense you never touch the command line for it; every knob is exposed in the gateway’s advanced settings. But knowing what it is doing under the hood — probing, averaging, comparing to thresholds — is what lets you set those knobs with intent instead of guessing.

How Does dpinger Decide a Link Is Down?
A gateway is marked down when its measured packet loss or latency crosses the “alarm” threshold you configured, sustained long enough to count. dpinger tracks two independent conditions — is loss too high, and is latency too high — and either one tripping is enough to fail the gateway, if you set the trigger to “packet loss or high latency.” The averaging window smooths out single bad probes so one dropped ping does not panic the whole system.
This two-number model is smarter than “can I reach the internet, yes or no.” A link can be technically up — probes still return — but so degraded that it is useless: 40% loss, or latency spiking to two seconds. dpinger catches both the clean death (100% loss, cable pulled) and the ugly slow death (a saturated or flapping upstream). The rolling average is the key defense against false alarms: because the daemon judges you on a window of probes rather than the most recent one, a lone lost packet on an otherwise healthy line moves the average only slightly and does not trip the alarm. That is by design, and it is why you should never try to make failover “instant” by shrinking the window to nothing.
Why Does Your Monitor IP Choice Matter More Than Any Threshold?
The monitor IP is where dpinger sends its probes, and choosing it badly makes every threshold meaningless. Point it at your ISP’s own gateway and you are testing whether the first hop is alive — not whether the internet beyond it works. The ISP router can answer your pings while the path behind it is completely dead, so your firewall thinks the line is healthy while nothing actually loads.
Use a stable, neutral, well-connected public address instead. I point each WAN’s monitor at a major public DNS resolver — 1.1.1.1 on one, 9.9.9.9 on the other — because those anycast addresses are effectively always up, live far past my ISP’s edge, and are not something my provider can make lie for it. Giving each WAN a different monitor target matters too: if both probe the same IP and that one host has a hiccup, both gateways look bad simultaneously and you get a phantom dual-failure. This was my second mistake, after the flapping one — I originally monitored a single distant server I happened to like, it went down for maintenance one night, and my firewall briefly concluded both my WANs were dead. Neutral, redundant, always-on targets fixed it for good.
What Do the Default Thresholds Mean?
OPNsense ships dpinger with sensible defaults: latency warnings around 200 ms and an alarm around 500 ms, packet loss warning around 10% and alarm around 20%, probed roughly once a second over a rolling window of about a minute. Those defaults are fine for many homes, but understanding each one lets you match them to your actual lines — a solid fiber deserves tighter numbers than a marginal cellular backup. The OPNsense gateways documentation lists every field if you want the exhaustive reference.
Here is how I think about the defaults versus what I actually run, and why:
| Setting | OPNsense default | What I run at home | Why |
|---|---|---|---|
| Latency alarm | ~500 ms | 500 ms | Left alone — anything slower than half a second is unusable anyway |
| Packet loss alarm | ~20% | 25% | Loosened slightly to survive brief congestion without flapping |
| Probe interval | ~1 second | 1 second | Frequent enough to react fast, light enough to ignore |
| Averaging window | ~60 seconds | 60 seconds | Long enough to smooth single lost probes into noise |
| Monitor IP | ISP gateway | 1.1.1.1 / 9.9.9.9 | The single most important change — test the real path, not the first hop |
Notice the biggest change I make is not a number at all — it is swapping the monitor IP off the ISP gateway. The threshold tweaks are minor; the target choice is fundamental.
How Do You Stop Failover From Flapping?
Flapping — the firewall bouncing rapidly between WANs — comes from thresholds so tight that normal network noise trips them. The fix is to loosen the loss alarm, keep a healthy averaging window, and never monitor a flaky target. Every switch resets your active connections, so a flapping failover is genuinely worse than no failover at all.
My own flapping episode is the reason I write about this so insistently. My first configuration used a 20% packet-loss trigger with a short window, and one evening a brief congestion spike on the primary — the kind that lasts fifteen seconds and clears — pushed loss over the line just long enough to throw me onto cellular. Then the primary recovered, and it threw me back. Mid-call, mid-download, twice in a minute, connections resetting each time. It felt like the network had a stutter. Widening the loss alarm to 25% and confirming the averaging window was a full minute made it stop instantly, because now a short spike gets averaged down below the trigger before it can act. If yours flaps, resist the urge to make failover more sensitive — make it more patient.
How Fast Should Failover Actually Be?
For a home, a detection-to-switch time of roughly 5 to 15 seconds is the sweet spot. Fast enough that an outage is a brief hiccup, slow enough that transient blips do not trigger needless switches. That window is a direct product of your probe interval and averaging settings — shrink them for speed and you buy flapping; widen them for stability and you buy a longer outage before failover kicks in.
Chasing sub-second failover at home is a mistake. The math is simple: to be sure a link is genuinely down rather than briefly noisy, dpinger needs to see the bad condition sustained across several probes in its window. Try to make that instant and you strip out exactly the smoothing that prevents false alarms. I run mine to switch in well under fifteen seconds, and in practice most of my devices never notice — a streaming buffer covers it, a video call drops a second of audio, and by the time anyone reaches for the router, cellular is already carrying the house. That is the right target: not invisible, just brief. If you need genuinely seamless, sub-second cutover, you are no longer talking about failover — you are talking about high availability, which is a different and much heavier tool.
How Do You Read the Gateway Widget?
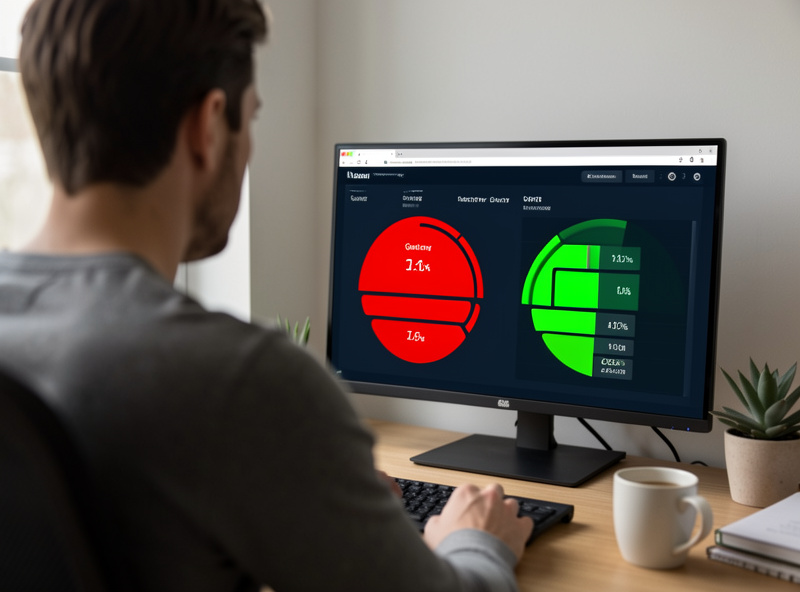
The OPNsense dashboard’s Gateways widget shows each gateway’s current status, its live RTT (round-trip latency), the RTTd (variation in latency, a good early warning), and the loss percentage. Green means healthy, amber means a warning threshold is crossed, red means down. Watching those numbers during your unplug test is how you confirm dpinger is behaving.
RTTd — the standard deviation of the round-trip time — is the number most people ignore and I watch closely. A rising RTTd means latency is getting jittery even if the average still looks fine, and jitter is the first symptom of a line about to degrade. On a healthy fiber my RTT sits low and steady with tiny RTTd; when my cellular backup is under load its RTTd climbs and wanders, which tells me the switch to backup, while working, is not something I want to live on for days. Pairing this widget with proper graphing — the kind you get feeding OPNsense metrics into Grafana, as in the Grafana and OPNsense monitoring build — turns “the internet felt weird last night” into an actual timestamped graph you can read. When failover misbehaves, that history is the difference between guessing and knowing. It is the same instinct behind the broader home network troubleshooting approach: measure, do not guess.
Further Reading
- Multi-WAN & Internet Failover: A Home Network Guide
- Setting Up Multi-WAN Failover in OPNsense
- Troubleshooting Home Network Slow Speeds and DNS Failures
- Monitoring OPNsense With Grafana, Telegraf and MQTT
What is dpinger in OPNsense and pfSense?
dpinger is a lightweight monitoring daemon that tracks gateway health. It sends ICMP probes to a target IP through each WAN about once per second and continuously measures packet loss and latency. The firewall uses those numbers to decide whether a gateway is healthy enough to carry traffic or should be marked down for failover.
What monitor IP should dpinger use for failover?
Use a stable, neutral public address rather than your ISP’s gateway. Public DNS resolvers like 1.1.1.1 and 9.9.9.9 are good choices because they are almost always reachable, live well beyond your ISP’s edge, and cannot be made to answer while the real path is down. Give each WAN a different target so one host’s outage cannot fake a dual failure.
Why does my multi-WAN failover keep flapping between connections?
Flapping usually means your packet loss threshold is too tight or your averaging window is too short, so brief congestion trips the alarm. Loosen the loss alarm slightly, keep the averaging window around a minute, and make sure your monitor IP is a rock-solid target. Failover should be patient, not maximally sensitive.
How fast does dpinger-based failover switch?
With typical settings, detection to switch takes roughly 5 to 15 seconds. That delay is intentional: dpinger needs to see the bad condition sustained across several probes in its averaging window before it trusts that the link is genuinely down, which prevents transient blips from triggering needless switches.
What is RTTd on the OPNsense gateway widget?
RTTd is the variation, or standard deviation, of the round-trip latency to your monitor IP. A low steady RTTd means a stable link; a rising RTTd means latency is getting jittery, which is often the first warning that a connection is starting to degrade even before packet loss shows up.