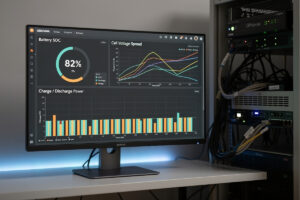
Grafana connected to InfluxDB and an MQTT broker receiving data from a JBD or JK BMS gives you a real-time state-of-charge dashboard for your home battery that updates every 30 seconds, with the OPNsense router’s own Telegraf plugin contributing the network-side metrics to the same dashboard. Telegraf runs as a real OPNsense plugin (os-telegraf, official OPNsense plugin repo) directly on the firewall, but Mosquitto, InfluxDB, and Grafana are not part of OPNsense’s supported plugin set — they run on a small always-on host on the same network, typically a Raspberry Pi or a NAS container, which is cheap enough to also sit on battery backup. The 48V LiFePO4 battery that powers the network gear is the same battery whose SOC you are monitoring, which means the dashboard keeps reporting even during a grid outage as long as that small host is also on backup power, and the SOC curve during an outage is the most valuable data you will ever collect from the system.
What Actually Runs Where
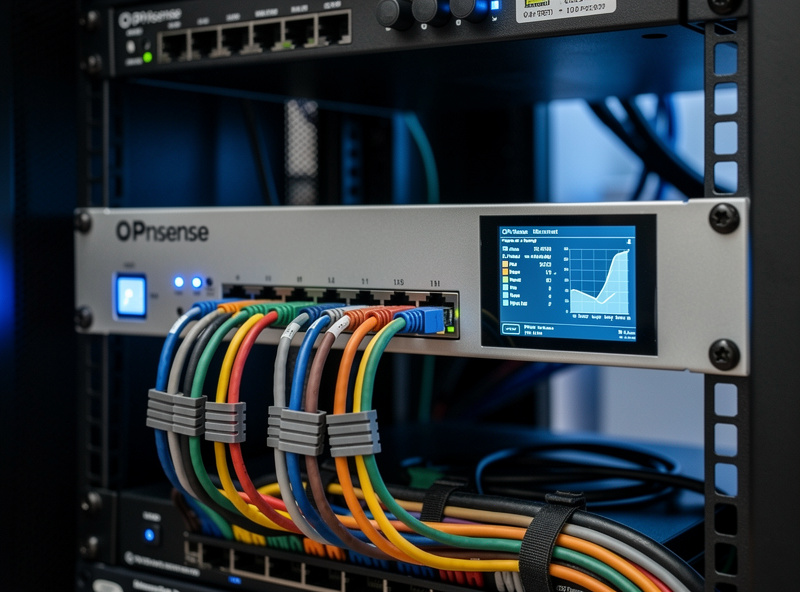
OPNsense is a FreeBSD-based firewall with a plugin system that supports Telegraf natively — os-telegraf installs from the OPNsense plugin manager with no Docker, no separate VM, no Raspberry Pi required, and it reads router-side system metrics (CPU, memory, network throughput, firewall states) and can push them to an InfluxDB instance elsewhere on the network. What OPNsense’s plugin system does not include is a Mosquitto MQTT broker, InfluxDB, or Grafana — none of those are in OPNsense’s official plugin repository, and the router’s Telegraf build is built to publish metrics out, not to subscribe to and consume arbitrary MQTT topics from a BMS. The honest architecture: the BMS publishes cell voltages and SOC via MQTT to a Mosquitto broker running on a small separate host (a Raspberry Pi or a NAS container is plenty), a Telegraf instance on that same small host (or a second Telegraf install, since Telegraf itself is just a lightweight Go binary you can run anywhere) subscribes to those MQTT topics and writes them to InfluxDB as time-series data, and Grafana queries InfluxDB to render the dashboard. OPNsense’s own Telegraf plugin adds the router-and-firewall metrics to the same InfluxDB instance so they land on the same dashboard. No cloud services, no external dependencies — the stack is entirely local, it just is not entirely on the firewall.
Hardware That Bridges the BMS to the Network
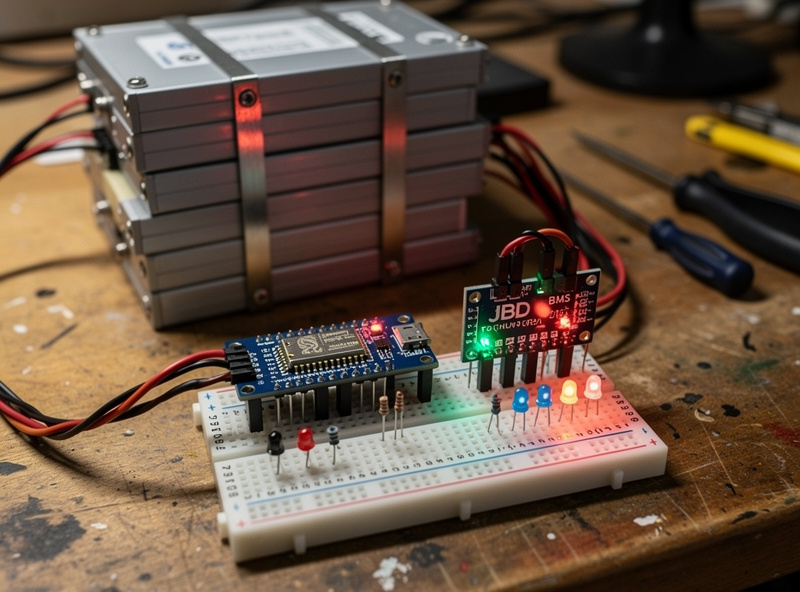
The physical connection starts at the BMS UART port inside the battery enclosure. A JBD BMS has a 4-pin UART header (TX, RX, GND, VCC) that connects to an ESP32 development board via a logic-level converter — the BMS runs at 3.3V UART and the ESP32’s GPIO pins are 3.3V-tolerant, but the converter protects against voltage spikes from the BMS during cell balancing when the internal electronics can briefly pull the UART line to pack voltage if the BMS’s onboard regulator glitches. The ESP32 runs the open-source bms-to-mqtt firmware, which polls the BMS every 5 seconds for the full data packet (16 cell voltages, pack voltage, current, SOC, 4 temperature sensors, cycle count, protection status flags) and publishes each value to its own MQTT topic on the local Mosquitto broker.
The ESP32 connects to the same Wi-Fi SSID that OPNsense hosts, or via Ethernet if your ESP32 has an Ethernet shield. The Wi-Fi path is simpler — the ESP32 costs $5, draws under 1 watt, and connects to the network that the OPNsense router manages. If the Wi-Fi link drops during a grid outage because the access point rebooted, the ESP32 automatically reconnects when the AP comes back, and the data gap in InfluxDB is visible as a flat line on the Grafana dashboard — which is itself a diagnostic signal that something in the network path failed during the outage.
| Component | Runs On | Purpose |
|---|---|---|
| JBD/JK BMS with UART-to-USB | Battery enclosure | Publishes cell voltages, SOC, current, temperature |
| Mosquitto MQTT Broker | Separate host (Raspberry Pi or NAS) | Receives BMS data and relays to Telegraf |
| Telegraf (battery instance) | Same separate host | Subscribes to MQTT topics, writes to InfluxDB |
| Telegraf (OPNsense plugin) | OPNsense (official plugin) | Adds router/firewall metrics to the same InfluxDB |
| InfluxDB | Raspberry Pi or NAS | Time-series database for all metrics |
| Grafana | Raspberry Pi or NAS | Dashboard visualization, alerting thresholds |
MQTT Topics Your BMS Should Publish
The JBD BMS with an ESP32 running the “bms-to-mqtt” firmware publishes the following MQTT topics that form the dashboard data stream. Each topic updates every 5-30 seconds depending on BMS polling rate, and Telegraf’s MQTT consumer input plugin subscribes to all of them with a single configuration block:
battery/soc → 87.3 (state of charge percentage)
battery/voltage → 53.12 (pack voltage)
battery/current → -12.4 (negative = discharging, positive = charging)
battery/power → -658 (watts, calculated by BMS)
battery/cell_01_voltage → 3.321 (through cell_16_voltage)
battery/temp_01 → 28.5 (through temp_04, Celsius)
battery/cycles → 247 (total charge/discharge cycles)
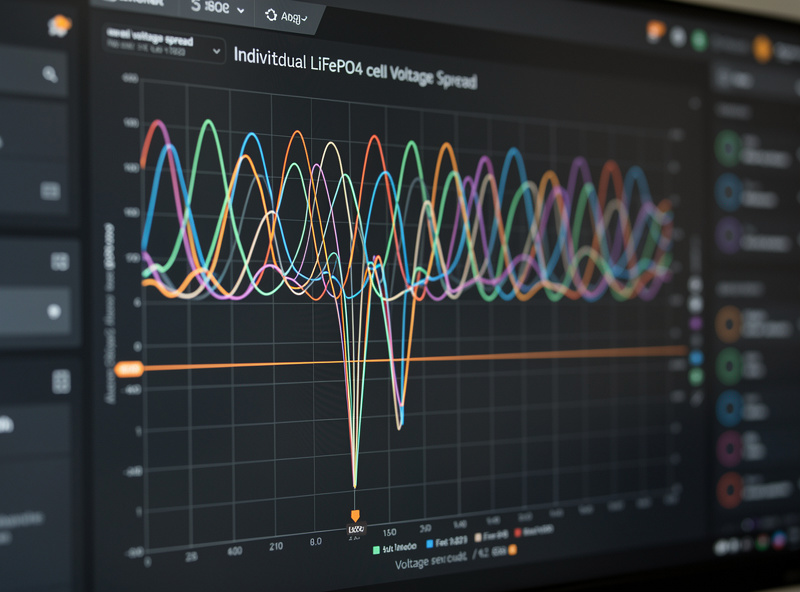
Grafana’s InfluxDB data source queries these topics as time-series measurements. The most useful dashboard panels are SOC over time (line graph, 24-hour and 7-day views), individual cell voltage spread (to catch a weak cell before it drags the whole pack below the BMS cutoff), charge/discharge power (stacked area chart showing when the battery charged from solar and when it fed the house), and a stat panel showing current SOC, pack voltage, and estimated runtime at current load — which is calculated as (remaining watt-hours) divided by (current watts draw) displayed in hours and minutes. The cell voltage spread panel is the most valuable early-warning indicator in the entire dashboard — a single cell that drops to 2.8V while the other 15 are at 3.2V under load is a failing cell, and catching it on a dashboard is the difference between replacing a $50 cell and replacing a $200 BMS that welded its discharge MOSFETs shut trying to compensate.
For the hardware side of a LiFePO4 system that produces this data — including cell selection, BMS wiring, and compression fixtures — the DIY LiFePO4 battery bank build guide on BatteryStorageHQ covers the electrical build that the monitoring stack here tracks.
Frequently Asked Questions
Can I monitor battery SOC from my OPNsense router?
Partly. OPNsense’s official Telegraf plugin adds your router and firewall metrics to the dashboard, but OPNsense does not officially package Mosquitto, InfluxDB, or Grafana, and its Telegraf build is not set up to subscribe to arbitrary MQTT topics from a BMS. Run Mosquitto, a second Telegraf instance, InfluxDB, and Grafana on a small separate always-on host (a Raspberry Pi or NAS works well), and let OPNsense’s own Telegraf plugin feed router metrics into the same InfluxDB instance. Nothing here needs cloud services.
What BMS works with MQTT for home battery monitoring?
JBD (JiaBaida) and JK BMS models with UART output connect to an ESP32 running bms-to-mqtt firmware. The ESP32 reads the BMS via UART and publishes cell voltages, SOC, current, and temperature to MQTT topics. Total cost for the ESP32 plus firmware is under $10 per battery pack.
How often does the Grafana battery dashboard update?
The BMS publishes data every 5-30 seconds, Telegraf writes to InfluxDB on the same interval, and Grafana refreshes the dashboard on a configurable 10-60 second auto-refresh. The 30-second update granularity captures inrush current from inverter startup and reveals transient voltage sag under heavy load.
Can I set Grafana alerts for low battery SOC?
Yes. Grafana alerting rules trigger when SOC drops below a configurable threshold — typically 20% for LiFePO4. Configure notification channels for email, Discord, or Pushover. Set a second alert at 10% SOC as the critical threshold that means the inverter will shut down within minutes if load does not decrease.
Does this monitoring stack work during a power outage?
Yes, as long as the small host running Mosquitto, InfluxDB, and Grafana is also on the same battery backup as the router. OPNsense itself is powered by the same 48V battery being monitored; put the Raspberry Pi or NAS running the rest of the stack on that same backup circuit and the dashboard continues collecting and displaying data throughout an outage. The SOC curve during discharge is the most valuable long-term data for sizing future battery expansions.
What Grafana dashboard panels are most useful for battery monitoring?
SOC over time (line graph with 24h and 7d views), individual cell voltage spread (detect weak cells), charge/discharge power (stacked area chart), and a stat panel showing current SOC with estimated runtime at current load in hours and minutes. Cell voltage spread is the most important early-warning metric in the entire pack.
Related Articles
- pfSense Configuration Guide: Complete Setup and Optimization
- pfSense Firewall Rules: The Beginner’s Guide
- OPNsense Firewall Rules: Complete Configuration Guide
- pfSense VLAN Setup: Complete Network Segmentation Guide
- Wi-Fi 6 Mesh for Smart Homes: Network Planning Guide