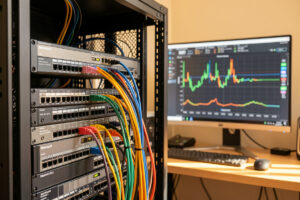
SNMP — Simple Network Management Protocol — is the oldest, lightest way to pull metrics off network gear, and on a home network its single best use is reading per-port counters off your managed switches. In my setup SNMP is the bridge that turns a switch from a silent box of blinking lights into a data source: bytes, packets, and errors for every port, polled into Grafana every minute.
This is a piece of the metrics layer in a home network monitoring stack. The firewall can tell you how much traffic crosses it, but it can’t tell you what’s happening on a link between two devices on the same switch. SNMP fills exactly that gap — the per-port visibility that answers “which cable is carrying what” — and it does it with almost no load because the switch is already counting; you’re just asking it for the numbers.
What SNMP Is Good For at Home
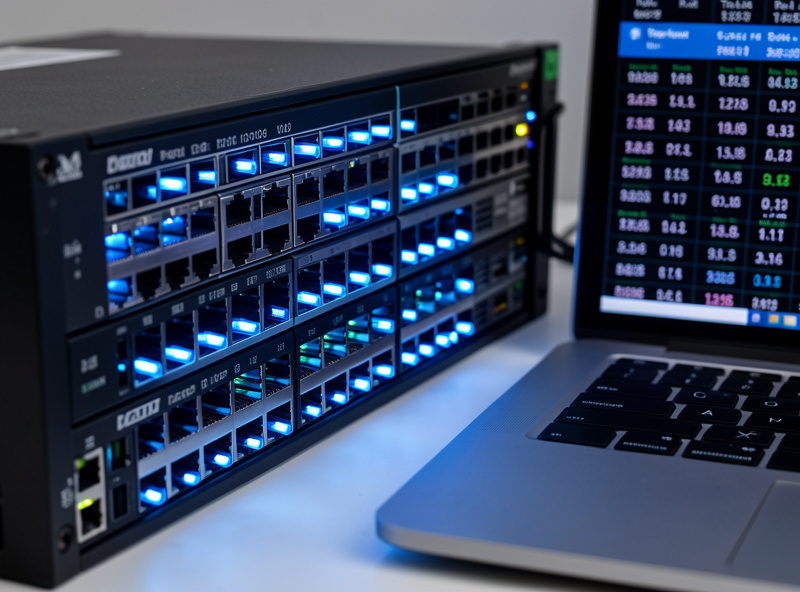
SNMP works by letting a poller (Telegraf, in my case) query a device for the value of specific objects identified by OIDs — numeric addresses in a tree called a MIB. In practice you rarely touch raw OIDs; you point Telegraf’s SNMP input at the standard interface MIB and it pulls in/out octets and error counters for every port automatically. That gives you, per switch port: throughput, packet rate, and crucially the error and discard counters that reveal a bad cable or a failing transceiver long before it becomes a total failure.
The error counters are the underrated part. A link that’s quietly logging CRC errors will work — until it doesn’t — and it shows up as degraded throughput and retransmits that are maddening to diagnose from the application side. With SNMP graphing error counters per port, a flaky patch run or a marginal SFP shows itself as a rising line on a graph weeks before it strands you. That’s the kind of slow failure the metrics layer exists to catch.
SNMP Versions: Use v3, Settle for v2c
SNMP comes in three versions and the difference matters for security. v1 is ancient and has no real security — skip it. v2c adds bulk transfers (much more efficient for polling many ports) but authenticates with a plain-text “community string” that’s effectively a password sent in the clear. v3 adds real authentication and encryption. On a network where SNMP traffic stays on a trusted management VLAN, v2c is the pragmatic common choice and what most home switches default to. If your gear supports v3, use it — there’s no reason to send even read-only management data in the clear if you don’t have to.
| Version | Security | Efficiency | Home Verdict |
|---|---|---|---|
| SNMP v1 | None (plain community string, no bulk) | Poor | Avoid |
| SNMP v2c | Plain-text community string | Good (bulk transfers) | Acceptable on a trusted management VLAN |
| SNMP v3 | Authentication + encryption | Good | Best, use it if supported |
Two rules I hold to regardless of version: make SNMP read-only (there’s a read-write mode that lets a poller change device config — you almost never want that at home, and it’s a liability if the community string leaks), and change the community string off the default “public.” Leaving SNMP open with the community string “public” is the networking equivalent of leaving the door unlocked, and it’s exactly what an attacker who’s already inside scans for.
Wiring SNMP Into the Monitoring Stack
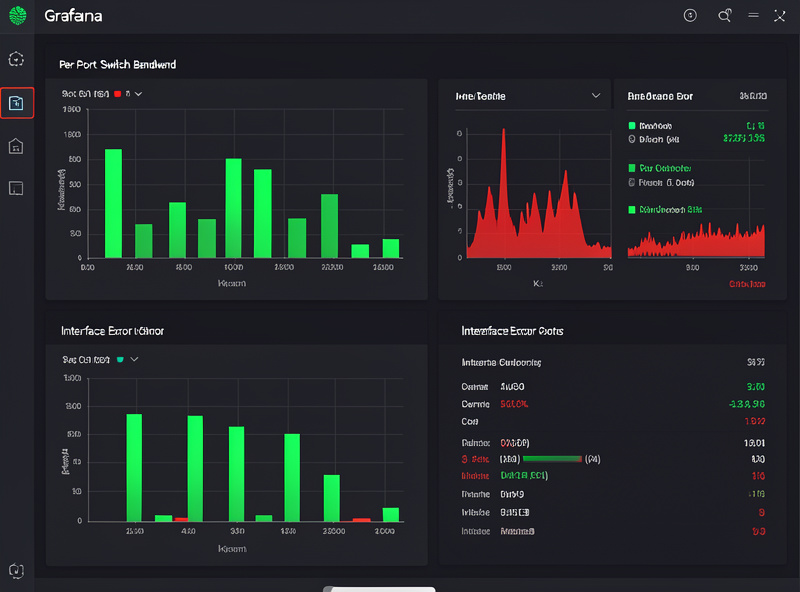
The clean path on a homelab: enable SNMP on each managed switch (read-only, custom community string or v3 credentials, restricted to the management VLAN), then add an SNMP input to Telegraf for each switch. Telegraf polls, writes to InfluxDB, and the data shows up in Grafana alongside everything else. There are ready-made Grafana dashboards for SNMP interface metrics that you import and point at your database, so you’re not building per-port panels by hand for a 24-port switch.
Restricting SNMP to the management VLAN is the part people skip and shouldn’t. SNMP exposes a detailed map of a device — interfaces, sometimes ARP tables and routes — so it’s reconnaissance gold for anything that gets a foothold on your network. I allow SNMP queries only from the monitoring host’s address, only on the management segment, blocked everywhere else by firewall rule. The same segmentation logic that governs the rest of the network applies here: the management protocols live on the management VLAN and nowhere else.
What to Monitor Beyond Switch Ports
Switches are the headline use, but plenty of home gear speaks SNMP. Many managed switches and access points expose port and radio stats; a lot of NAS units report disk health, temperature, and volume status over SNMP; and some UPS units report battery status and load that way too. A useful tier-two SNMP target on my network is the NAS — pulling its temperatures and pool status into the same Grafana means the thing the whole house depends on is on the same health dashboard as the network.
What I deliberately don’t do is SNMP-everything. For hosts I run a Telegraf agent directly, which gives richer metrics than SNMP would; SNMP earns its place specifically for the closed appliances — switches, NAS, UPS — where you can’t install an agent. Use the agent where you can, SNMP where you can’t, and you get full coverage without polling everything twice.
SNMP’s Limits
SNMP is a polling protocol, so your resolution is only as fine as your poll interval — a one-minute poll won’t catch a two-second microburst. For that kind of detail you want flow analysis with ntopng or a packet capture with Wireshark. SNMP also only reports what a device chooses to expose, which varies by vendor. None of that diminishes its core value: for steady per-port throughput and error trends across your switching, polled cheaply into the same dashboards as the rest of the stack, nothing is simpler.
Frequently Asked Questions
Is SNMP secure enough to use at home?
SNMP v3 adds authentication and encryption and is secure to use. SNMP v2c sends a plain-text community string, so it is only acceptable when SNMP traffic is confined to a trusted management VLAN and queries are restricted by firewall rule to your monitoring host. Always set it read-only and change the community string off the default public.
What can I actually monitor with SNMP at home?
The headline use is per-port counters on managed switches: throughput, packet rate, and error and discard counters for every port. Beyond switches, many NAS units, access points, and UPS devices expose health data like temperature, disk status, and battery state over SNMP, so it covers the closed appliances where you cannot install an agent.
Do I need a managed switch for SNMP monitoring?
Yes for per-port switch monitoring. Unmanaged switches do not speak SNMP and cannot report counters, which is one of the main reasons to choose a managed switch for a homelab. Other devices like a NAS or UPS can be SNMP targets independently of your switch.
How does SNMP fit with Grafana and Telegraf?
Telegraf has an SNMP input plugin that polls your devices and writes the metrics to InfluxDB, where Grafana visualizes them. You enable read-only SNMP on the device, point Telegraf at it, and import a ready-made SNMP dashboard. The switch counters then live on the same dashboards as your firewall and host metrics.
Why are SNMP error counters important?
Interface error and discard counters reveal a failing cable, a marginal transceiver, or a duplex mismatch before it causes an obvious outage. A link logging rising CRC errors still passes traffic but with retransmits that degrade performance in ways that are hard to diagnose from the application side. Graphing these counters catches the problem early.
Related Guides
- Home Network Monitoring and Observability — the full monitoring stack
- Grafana, InfluxDB and Telegraf — where SNMP data lands
- ntopng for Home Network Monitoring — flow detail SNMP can’t give
- Managed Switch Setup — the gear SNMP reads from
- VLAN Firewall Rules — locking SNMP to the management VLAN