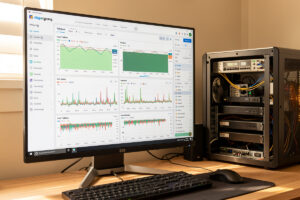
ntopng is an open-source network traffic monitor that watches every flow on your network and builds a live, browsable map of who is talking to whom. In my setup it’s the tool I open when Grafana says the pipe is full and I need to know which device filled it — it resolves a single saturated interface into a ranked list of hosts, flows, and remote destinations in seconds.
This is the flow-analysis layer of a home network monitoring stack. Metrics tools tell you a link is busy; ntopng tells you the busy link is the living-room TV streaming to a CDN while a smart bulb on the IoT VLAN quietly beacons to an address three countries away. That second answer is the one that changes a firewall rule.
What ntopng Actually Does
ntopng passively inspects traffic and tracks every active flow — source, destination, port, protocol, bytes, and duration — then aggregates that into per-host and per-talker views you read in a browser. It does Layer 7 application detection through nDPI, so instead of “TCP 443 to some IP” you get “this is a Netflix flow” or “this is a BitTorrent flow,” which is the difference between a number and an answer.
What it is not: ntopng is not a packet-capture tool in the Wireshark sense. It summarizes flows; it doesn’t hand you the individual bytes of a broken TLS handshake. The two live next to each other in the stack — ntopng narrows the problem to one host and one conversation, and Wireshark dissects that conversation if you need to go deeper. Most of the time ntopng alone is enough, because most home-network mysteries are “what is using my bandwidth,” not “why is this one packet malformed.”
Getting Traffic Into ntopng
ntopng can only see what you feed it, and on a switched network a device only sees its own traffic by default. There are three practical ways to give ntopng a full view on a home network, and the right one depends on where your traffic concentrates.
Run it on the firewall. If you run OPNsense, ntopng is available as a plugin that watches the interfaces directly — WAN, LAN, and each VLAN. This is the cleanest option because the firewall already sees every packet routed between segments, and it needs no extra hardware. It’s how I started, and for most home networks it’s all you need. The tradeoff is CPU: deep inspection on a busy multi-gig link adds load to the box that can least afford to fall over.
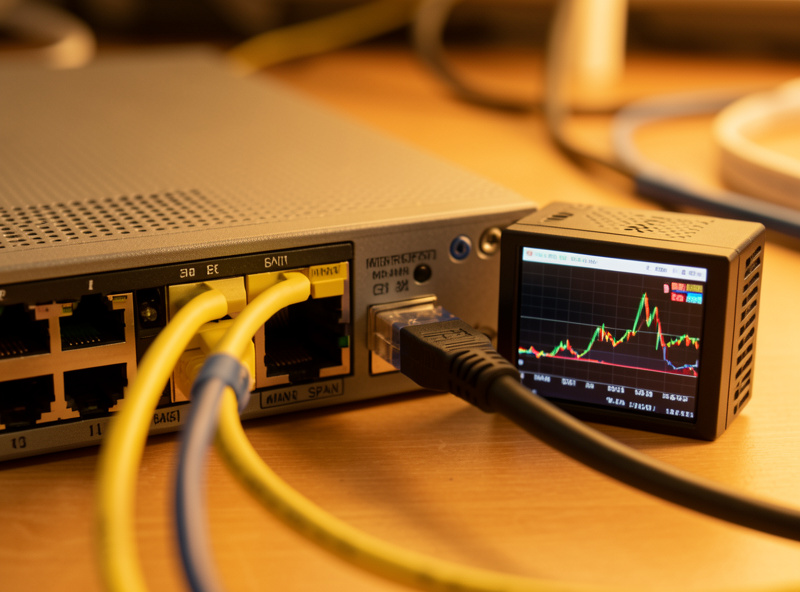
Mirror a port (SPAN). A managed switch can copy all traffic from one port (or the whole switch) to a mirror/SPAN port, and you plug a dedicated ntopng box into that mirror. This offloads the work from the firewall and lets a separate machine do the heavy lifting. It’s the right move once inspection load is real, and it’s how you’d watch intra-VLAN traffic that never touches the router.
Export NetFlow/sFlow. Many firewalls and switches can export flow records (NetFlow, IPFIX, sFlow) to a collector, and ntopng ingests them. You lose the deep packet detail but you keep the flow picture with almost no overhead, which is attractive on higher-speed links where full inspection is expensive.
| Method | Setup Effort | Detail Level | Overhead | Best For |
|---|---|---|---|---|
| Plugin on OPNsense | Low | Full (nDPI) | On the firewall | Most home networks |
| Port mirror (SPAN) | Medium | Full (nDPI) | On a separate box | Busy links, intra-VLAN traffic |
| NetFlow/sFlow export | Medium | Flow-level only | Very low | High-speed links |
Running ntopng on the Homelab
Where I run mine: ntopng lives as a container on the Proxmox host, on the management VLAN, taking a NetFlow export from OPNsense for the lightweight always-on picture and a SPAN feed when I want full detail on a specific segment. A single small container handles a home network’s flow volume without breaking a sweat; the storage cost is the flow history database, which you size to how far back you want to look.
The community edition is free and covers everything a home network needs — live flows, host views, historical flows, alerts, and the geographic map. The paid tiers add long-term historical analytics and behavioral features that matter at business scale; at home I’ve never hit the edge of what the free version does. Keep the web UI off any internet-facing path: like every monitoring dashboard, it’s a complete inventory of your network and belongs behind authentication and a VPN, on its own segment, exactly as I cover in the monitoring overview.
Reading the Dashboards Without Drowning
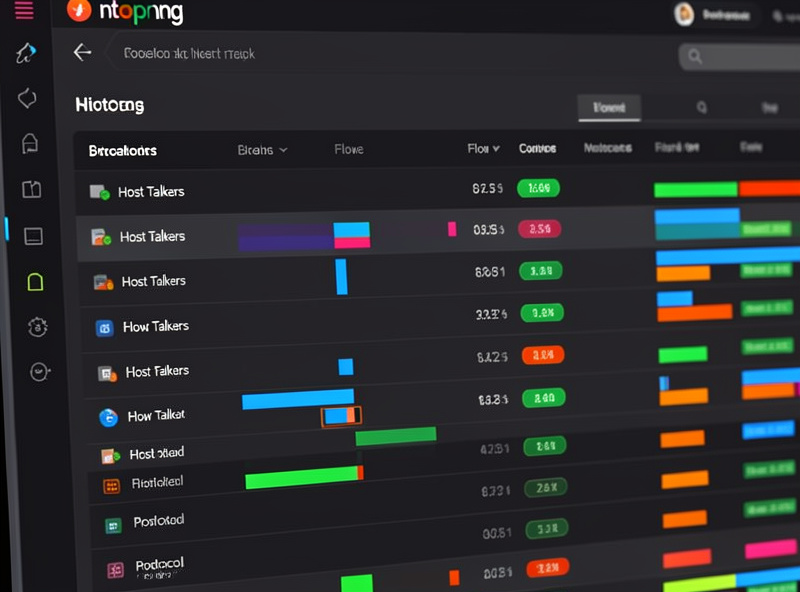
The first time you open ntopng it throws a wall of numbers at you. The three views that earn their keep day to day are Top Hosts (Talkers), Active Flows, and Hosts by application protocol. Top Talkers ranks your local devices by traffic right now — this is where the answer to “why is the network slow” almost always lives, because the offender is usually sitting at the top of that list. Active Flows shows every live conversation with its protocol and destination, which is how you catch a device talking to somewhere it shouldn’t.
The application-protocol view is the one that makes ntopng worth running over a plain bandwidth meter. Because nDPI classifies traffic by application, you can see that 60% of your evening traffic is video streaming, that a particular host is doing a lot of cloud-backup uploads, or that something is running peer-to-peer when nothing should be. On a segmented network I read these per-VLAN: the IoT segment should be almost silent and mostly local, so any IoT host showing sustained external flows is the first thing I investigate.
What ntopng Catches That Nothing Else Does
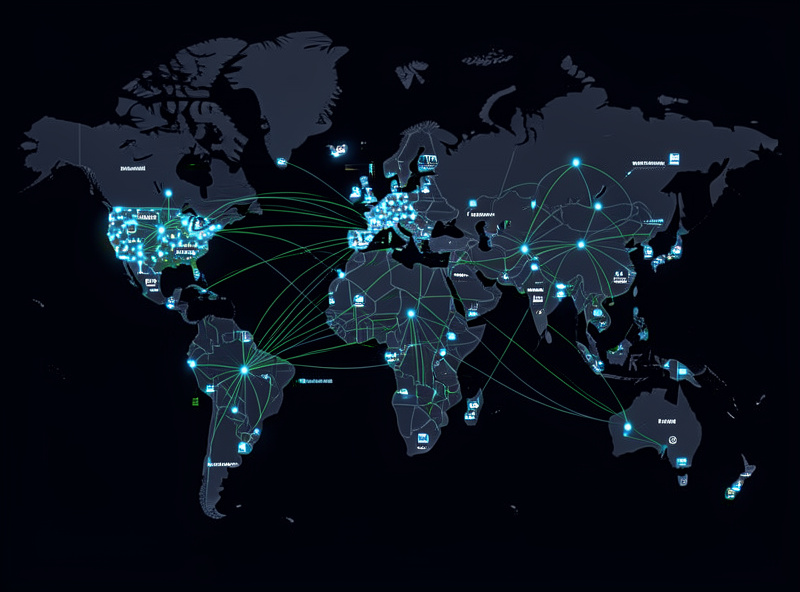
The reason ntopng sits in my permanent stack rather than being a one-off troubleshooting tool is that it surfaces things you wouldn’t think to look for. A few real shapes of problem it has caught on my network: an IoT device hammering a vendor’s cloud every few seconds after a firmware update, which showed up as a constant low-rate flow that no bandwidth graph would flag as a problem; a guest device on the isolated guest network trying repeatedly to reach internal addresses, exactly the probing the isolation is built to stop; and a backup job misconfigured to run over the WAN instead of the LAN, visible instantly as an outbound flow that should have been internal.
None of those are dramatic breaches. They’re the small misconfigurations and chatty devices that a segmented network is designed to contain, and ntopng is how you verify the containment is actually working rather than assuming it. It turns “I think my VLANs are isolated” into “I can watch the traffic and confirm nothing crosses that shouldn’t.”
Where ntopng Fits Against the Rest of the Stack
ntopng owns flows; it does not replace the other layers. For long-term metric trends — throughput over weeks, capacity planning — the Grafana, InfluxDB and Telegraf stack is the right home, and ntopng can even export to InfluxDB so its numbers live in your Grafana dashboards too. For simple “how much have I used this month” answers, lightweight bandwidth monitoring tools are less work. For uptime, that’s Uptime Kuma’s job. ntopng’s lane is the live, who-is-talking-to-whom question, and within that lane nothing on the free homelab menu does it better.
Frequently Asked Questions
Does ntopng slow down my network?
Run as a passive monitor it adds no latency to traffic because it inspects copies of packets, not the live path. The cost is CPU and memory on whatever box runs it. On a firewall, deep inspection of a busy multi-gig link can add real load, which is why a port mirror to a separate machine or a NetFlow export is the lighter option on fast links.
Do I need a managed switch to use ntopng?
Not necessarily. If you run ntopng on your firewall it sees all routed traffic between VLANs and the internet without any switch features. You only need a managed switch with port mirroring if you want to watch traffic that stays inside one VLAN and never crosses the router.
Is the free version of ntopng enough for a home network?
Yes. The community edition covers live flows, host and talker views, historical flows, application detection through nDPI, alerts, and the geographic map. The paid tiers add long-term analytics and behavioral features aimed at business scale that a home network rarely needs.
What is the difference between ntopng and Wireshark?
ntopng summarizes flows continuously and answers who is talking to whom and how much. Wireshark captures individual packets on demand and answers what exactly is in this one conversation. You use ntopng to narrow a problem to a host, then Wireshark to dissect that host’s traffic if you need byte-level detail.
Can ntopng send its data to Grafana?
Yes. ntopng can export metrics to InfluxDB, which means its flow and host statistics can appear on the same Grafana dashboards as the rest of your network metrics. That lets you keep ntopng for live investigation while your long-term trend graphs all live in one place.
Related Guides
- Home Network Monitoring and Observability — the full stack this fits into
- Grafana, InfluxDB and Telegraf — the metrics layer ntopng feeds
- VLAN for IoT — the segmentation ntopng helps you verify
- Managed Switch Setup — how to configure a mirror port
- Network Segmentation — dividing the network ntopng watches