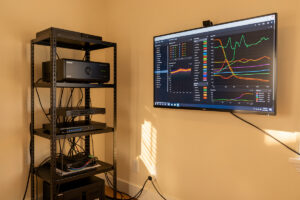
Home network monitoring is the practice of continuously collecting metrics, flows, and logs from your router, switches, and hosts so you can see what the network is actually doing instead of guessing. In my setup, a proper monitoring stack turns “the internet feels slow” into a timestamped graph showing exactly which VLAN saturated the uplink at 21:14 last night.
I run a segmented network at home — OPNsense on dedicated hardware, a Proxmox host as the spine, managed switches trunking VLANs out to the hydro lab, the workshop sensors, the kids’ consoles, and an isolated IoT segment. Once you have that many moving parts, “is the network okay?” stops being answerable by feel. This guide is the map of how I monitor mine: the four layers of observability, which tool owns which job, and the order I’d build them in if I were starting over today.
The Four Layers of Network Observability
Network observability at home breaks into four data types: availability (is it up?), metrics (how loaded is it?), flows (who is talking to whom?), and logs (what did it say happened?). No single tool covers all four well, which is why a real stack is three or four tools that each own one layer and hand off to the next.
The mistake I see in every homelab thread is someone installing one shiny dashboard and expecting it to answer every question. Grafana draws beautiful graphs but it doesn’t capture packets. Wireshark dissects a packet down to the byte but it can’t tell you the WAN was down for six minutes at 03:00. You build the stack in layers because the questions come in layers.
Layer 1: Availability Monitoring (Is It Up?)
Availability monitoring is the cheapest, highest-value layer and the one most people skip. A lightweight uptime checker pings your gateway, your DNS resolvers, your NAS, and your self-hosted services on a fixed interval and screams when one stops answering. In my lab, this is the layer that catches a dead Pi-hole at 02:00 before the whole house notices DNS resolution failing at breakfast.
The tool I run here is Uptime Kuma, a self-hosted status-page app that checks HTTP endpoints, TCP ports, ping, and DNS records on schedules you set. It’s a single Docker container, it stores history, and it pushes alerts to a phone. The discipline that matters is what you monitor: not just “is the internet up” but every internal dependency — the firewall web UI, both DNS resolvers, the reverse proxy, the NAS shares. When something breaks, the dashboard tells you which thing, not just that “something” is wrong.
Availability monitoring is also where you encode your redundancy. I run Pi-hole and AdGuard Home as redundant resolvers precisely so one can die without taking the house offline — and the uptime checker is what tells me one died so I can fix it before the second one does too.
Layer 2: Metrics and Trends (How Loaded Is It?)
Metrics monitoring records numbers over time: CPU on the firewall, interface throughput per port, memory on the Proxmox host, temperature on the NAS, WAN latency. Individually each number is boring. Plotted over weeks, they tell you the firewall state table is creeping toward its limit, or that the WAN jitter spikes every evening, or that a drive is running 8°C hotter than its neighbors and is probably about to fail.
The canonical homelab metrics stack is Grafana, InfluxDB, and Telegraf — Telegraf collects, InfluxDB stores time-series data, and Grafana visualizes it. This is the stack I already use to graph my home battery state of charge, and the exact same pipeline pulls metrics straight off OPNsense. Once Telegraf is running on the firewall and the host, you point it at everything: SNMP from the managed switches, the system plugin from each Proxmox node, the ping plugin for WAN latency.
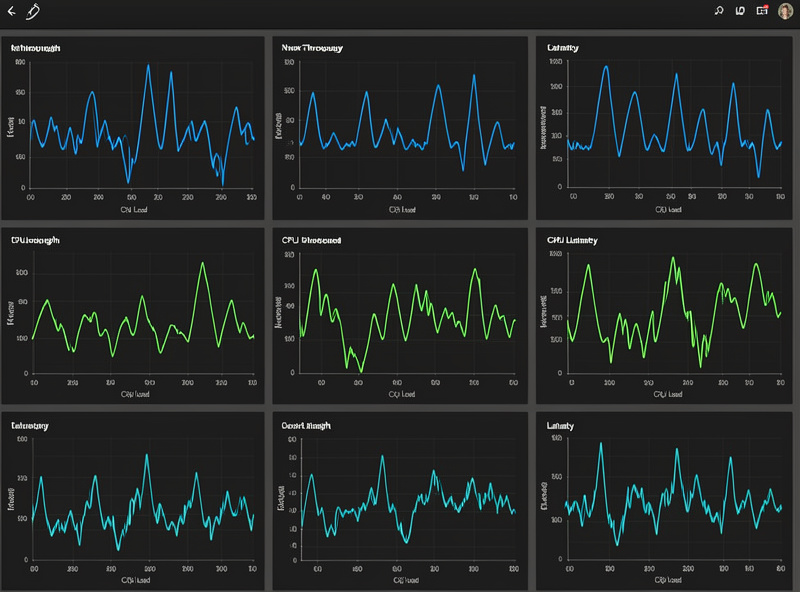
The reason metrics matter for a segmented network specifically: when I trunk seven VLANs through one firewall, the aggregate “WAN is busy” number is useless. I need per-interface and per-VLAN throughput so I can see that the IoT segment is the one hammering the uplink, or that the backup job to the NAS is what saturates the LAN every night at 01:00. SNMP on the switches gives me per-port counters; Telegraf on the firewall gives me per-interface bytes. Together they answer “who is using the pipe.”
Layer 3: Flow and Traffic Analysis (Who Is Talking to Whom?)
Flow analysis answers the question metrics can’t: which device, talking to which destination, over which protocol. Metrics tell you interface 3 pushed 400 Mbps; flow analysis tells you it was the living-room TV streaming to a CDN while a smart plug phoned home to an IP in another country. This is the layer where you catch the misbehaving IoT device that an IoT VLAN is supposed to cage.
The tool I lean on here is ntopng, which reads traffic off the firewall (via a mirror port, NetFlow, or by running on OPNsense directly) and builds a live map of every host, every flow, and every talker on the network. For per-interface bandwidth without the deep host detail, simpler bandwidth monitoring tools — the OPNsense traffic graphs, vnStat, ntopng’s lighter views — cover most of what a home network needs day to day.
When flow analysis flags something genuinely weird — an unexpected port, a flow that shouldn’t cross between two VLANs — that’s when you drop down to the deepest layer.
Layer 4: Packet Capture and Logs (What Actually Happened?)
The bottom layer is forensic. Wireshark captures and dissects individual packets so you can see the actual bytes on the wire — the DHCP handshake that’s failing, the TLS negotiation that won’t complete, the retransmits killing throughput on one link. You don’t run Wireshark all day; you reach for it when a specific thing is broken and the higher layers have narrowed it to one conversation.
Logs are the other half of “what happened.” Your firewall, switches, DNS resolvers, and reverse proxy all emit log lines, and on a default setup those logs live in twelve different places and roll over before you need them. Centralizing them with Graylog or the ELK stack gives you one searchable place where “show me every blocked connection to the IoT VLAN last Tuesday” is a query, not an archaeology project. For a home network Graylog is the lighter lift; full ELK earns its weight only once you’re ingesting a lot of sources.
How the Layers Fit Together: A Worked Example
Here’s how the stack actually works when something goes wrong, using a real shape of problem from my own network. The symptom: video calls drop every evening around 20:00.
Availability (Uptime Kuma) shows the WAN never actually went down — no outage, so it’s not a dead link. Metrics (Grafana/Telegraf) show WAN latency climbing from 12 ms to 180 ms exactly when the calls degrade, and interface throughput on the LAN trunk maxing out. So something is saturating the pipe. Flow analysis (ntopng) names the culprit: a media server on the LAN VLAN running a nightly library scan that uploads thumbnails to a cloud account. Logs (Graylog) confirm the firewall is shaping nothing because there’s no QoS rule for it. Fix: a traffic-shaping rule and a schedule change on the scan. Four tools, four questions, one fix. No single tool would have gotten me there.
Choosing Your Monitoring Stack: A Comparison
You do not need all of these on day one. Below is how I’d categorize the core tools by the layer they own, the resources they need, and where they fit on a home network. Start at the top and add downward as your questions get harder.
| Tool | Layer | What It Answers | Resource Load | Best For |
|---|---|---|---|---|
| Uptime Kuma | Availability | Is each service up right now? | Very light (one container) | Everyone, build this first |
| Grafana + InfluxDB + Telegraf | Metrics | How loaded, trending which way? | Moderate (three services) | Long-term trends, capacity |
| SNMP polling | Metrics | Per-port switch counters | Very light (polling) | Managed-switch visibility |
| ntopng | Flows | Who is talking to whom? | Moderate (needs traffic feed) | Per-host traffic, anomalies |
| vnStat / built-in graphs | Bandwidth | Per-interface usage over time | Very light | Quick bandwidth answers |
| Wireshark | Packets | What exactly is on the wire? | On-demand only | Deep troubleshooting |
| Graylog / ELK | Logs | What did each device report? | Heavy (Graylog moderate, ELK heavy) | Centralized searchable logs |
Where to Run the Stack
On my network the monitoring stack lives on the Proxmox host, mostly as LXC containers and Docker workloads. Uptime Kuma, Grafana, InfluxDB, and ntopng are each light enough that a modest mini PC or an old desktop running Proxmox handles all of them with room to spare. Graylog wants more RAM because it sits on top of a search engine, so I give it its own VM.
The one architectural decision that matters: put the monitoring stack on its own management VLAN. Monitoring tools talk to everything — the firewall, the switches, every host — so they’re a high-value target and a natural pivot point. I keep mine on the MANAGEMENT segment with tight firewall rules that let the collectors reach their targets and nothing reach back. The same segmentation discipline that governs the rest of the network applies double to the thing that can see all of it.
If you’re self-hosting these behind a reverse proxy for clean access, keep the dashboards off any internet-facing path unless they’re behind authentication and WireGuard. A Grafana dashboard exposed to the open internet is an inventory of your entire network handed to anyone who finds it.
Alerting: The Part That Makes Monitoring Worth It
A dashboard you have to remember to look at is not monitoring — it’s a hobby. The thing that turns graphs into actual operational value is alerting: the system pushing a notification to you the moment a threshold trips, so you find out about the dead resolver from your phone and not from your kid yelling that Roblox won’t load. Every tool in this stack can alert, and the discipline is deciding what’s worth waking up for.
I keep alerting tiered. Hard-down events — a DNS resolver stops answering, the firewall web UI is unreachable, the NAS drops off — page me immediately through Uptime Kuma’s push notifications. Trend warnings — a disk crossing 80% full, WAN latency averaging high for an hour, a drive temperature climbing — come from Grafana alert rules and land in a low-priority channel I check daily, not instantly. Security-relevant log patterns — repeated blocked connections from the IoT VLAN trying to reach the internet, a flood of authentication failures on the reverse proxy — come out of Graylog. The mistake that kills alerting is making everything urgent: if every blip pages you, you mute the channel within a week and you’re back to flying blind.
The other half of useful alerting is tuning out the noise that isn’t real. A WAN that briefly spikes when a backup kicks off isn’t an incident; a threshold that fires on a five-second blip just trains you to ignore it. I set sustained-duration conditions — “latency over 100 ms for five minutes,” not “latency over 100 ms once” — so an alert means something genuinely changed. Good alerting is mostly the art of deleting alerts until the only ones left are the ones you’d actually act on.
A Sane Build Order
If you’re starting from an ISP router and a vague sense that you should “monitor things,” here’s the order I’d add tools, each one earning its place before the next:
First, availability. Stand up Uptime Kuma and point it at your gateway, DNS, and any service you’d notice going down. This alone catches most of the “why is the internet broken” pages before anyone else in the house notices. Second, metrics. Add the Grafana/InfluxDB/Telegraf stack and start with firewall interface throughput and WAN latency — the two graphs you’ll look at most. Third, flows. Add ntopng once you want to know which device is responsible for the numbers Grafana shows. Fourth, logs and packets. Add Graylog when your logs are scattered and you’re tired of grepping six devices, and keep Wireshark in the toolbox for the day a single conversation is broken.
Most home networks are well served stopping after the first three. The bottom layer is there for when you need it, not as a daily dashboard. If you’ve already built a self-hosting platform, every one of these slots in next to your existing services with no new hardware. And if monitoring keeps surfacing the same DNS failures, the home network troubleshooting guide walks the fixes.
Frequently Asked Questions
Do I really need a network monitoring stack at home?
If you run more than an ISP router, yes. Even a single Uptime Kuma container that pings your gateway, DNS resolvers, and NAS will catch outages before the rest of the household does. The deeper layers (metrics, flows, logs) become worth it once you run VLANs, self-hosted services, or anything you would notice failing.
What is the difference between metrics and flow monitoring?
Metrics record numbers over time, such as interface throughput or CPU load, and answer how loaded the network is. Flow monitoring records who is talking to whom, which device and which destination, and answers what is actually using the bandwidth. You need both because metrics tell you the pipe is full and flows tell you which host filled it.
How much hardware do I need to run a monitoring stack?
Less than people expect. Uptime Kuma, Grafana, InfluxDB, and ntopng together run comfortably on a modest mini PC or old desktop hosting Proxmox. Only Graylog and full ELK want real RAM because they sit on a search engine. A single small node handles a typical home network with capacity to spare.
Should monitoring tools run on their own VLAN?
Yes. Monitoring collectors talk to the firewall, switches, and every host, which makes them a high-value pivot point. Keep them on a management VLAN with firewall rules that let collectors reach their targets but block return paths, and never expose a dashboard to the open internet without authentication and a VPN in front of it.
Which monitoring tool should I install first?
Availability monitoring, almost always Uptime Kuma. It is a single container, it catches the most common real-world failures (dead DNS, a service that crashed overnight), and it requires no traffic mirroring or agent deployment. Add metrics, then flows, then logs as your questions get harder.
Is SNMP still worth using on a home network?
On managed switches, yes. SNMP polling is the simplest way to pull per-port byte and error counters into Grafana, and it is lightweight because the switch does the counting. It is the missing piece that turns aggregate firewall throughput into a per-port picture of which link is carrying what.
Related Guides
This hub anchors a full cluster on home network monitoring. Each spoke goes deep on one tool or layer:
- ntopng for Home Network Monitoring — live host and flow analysis
- Grafana, InfluxDB and Telegraf for the Homelab — the metrics stack
- SNMP Monitoring at Home — per-port switch visibility
- Uptime Kuma Setup Guide — availability and status pages
- Bandwidth Monitoring Tools — per-interface usage
- Wireshark Packet Capture — deep packet forensics
- Network Log Management with Graylog or ELK — centralized logs
For the infrastructure these tools run on, see the Proxmox homelab setup guide and the home network VLAN guide.