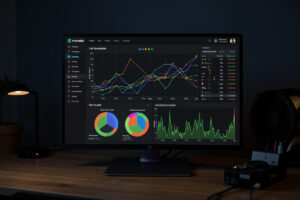
Network traffic analysis in a homelab means going beyond “something matched a signature” to actually seeing the shape of what your network is doing — which devices talk to whom, how much, and over what protocols. An IDS gives you alerts; traffic analysis gives you a baseline, and the baseline is what lets you notice that the smart plug which normally sends a few kilobytes a day is suddenly streaming gigabytes to an address you’ve never seen.
This is the layer that turns a home network from a black box into something you understand. It’s also where a homelab’s biggest blind spot lives: a firewall-based IDS only sees traffic that crosses the firewall, so everything two devices say to each other on the same VLAN is invisible to it. Closing that gap, and building a picture of normal so abnormal stands out, is what traffic analysis is for. Here’s how I approach it at homelab scale — deliberately not enterprise observability, just enough to actually know my own wire.
Why an IDS isn’t enough on its own
Signature detection answers “did anything match a known-bad pattern?” That’s valuable but narrow. It can’t tell you that a device’s behavior changed, only that a specific rule fired. Most of the genuinely interesting findings on a home network are behavioral: a new device appeared, an old device started talking to a new destination, traffic volume to somewhere jumped. None of that trips a signature, but all of it is obvious in a traffic baseline. The intrusion detection guide covers the alerting side; this is the complementary half — visibility, not just detection.
The visibility problem: SPAN and mirror ports
Start with the hard limit, because it shapes everything else. A software IDS or analyzer running on the firewall sees north-south traffic — anything going between a VLAN and somewhere else, because that crosses the firewall. It does not see east-west traffic between two hosts on the same switch and VLAN; that traffic never leaves the switch fabric. If a compromised laptop scans other devices on its own segment, the firewall — and any IDS on it — is blind to it.
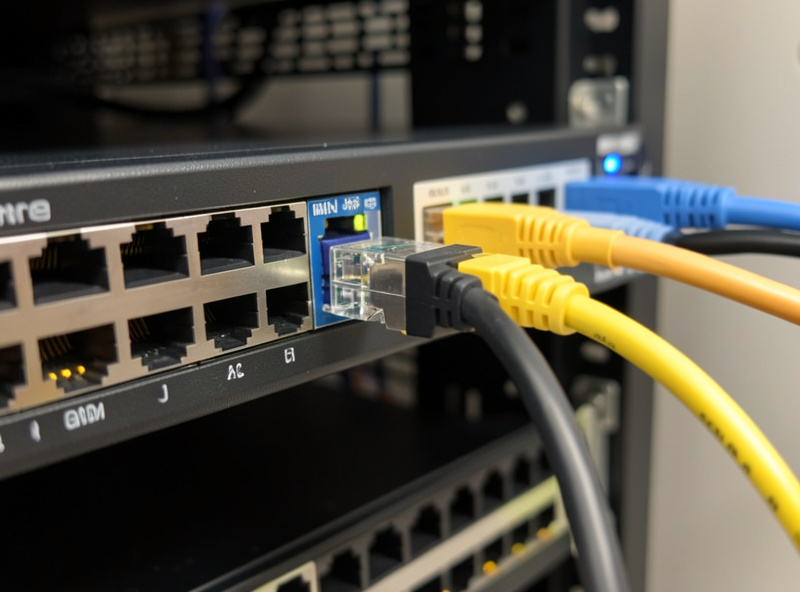
The fix is a SPAN port (also called port mirroring), a feature on any decent managed switch. You configure the switch to copy traffic from a port, a set of ports, or a whole VLAN to a designated mirror port, then plug a dedicated analysis machine into that port. Now your analyzer sees the intra-VLAN conversations the firewall misses. At home this is usually a Raspberry Pi or a small VM with a NIC on the mirror port running a capture or flow tool. It’s the single biggest visibility upgrade you can make, and it’s the prerequisite for catching lateral movement — which is exactly why VLAN segmentation and a managed switch underpin the whole effort.
Flow-level analysis: NetFlow, sFlow, and ntopng
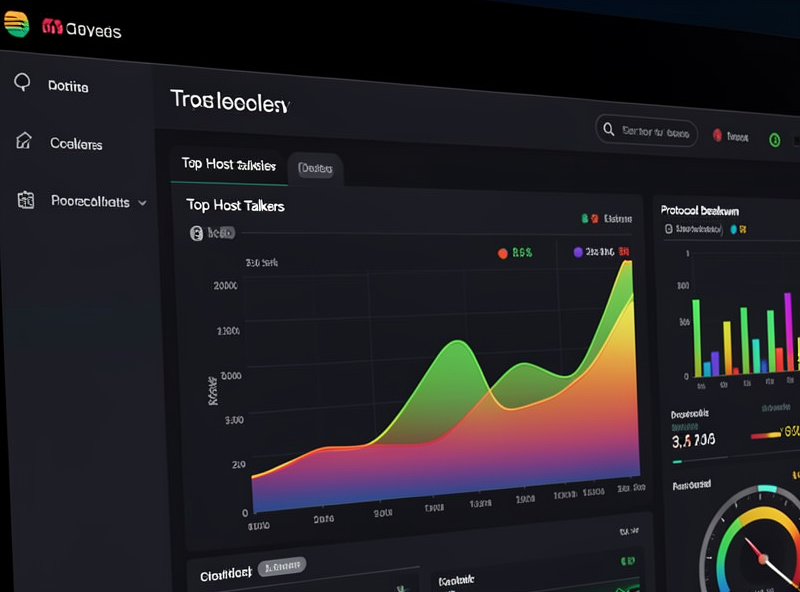
You don’t always need every packet. Flow data — NetFlow, sFlow, IPFIX — summarizes conversations: source, destination, ports, byte and packet counts, duration. It’s lightweight, it’s exported by most managed switches and by OPNsense/pfSense, and it’s enough to answer the questions that matter most at home: who are my top talkers, where is my traffic going, and has any of that changed?
ntopng is the home-lab favorite for consuming this. Point your firewall’s flow export or a SPAN port at it and you get live dashboards of top hosts, protocols, and destinations, with historical trends. For most home labs, ntopng plus the firewall’s own dashboards is the entire traffic-analysis stack — it gives you the behavioral baseline without drowning you in packet detail. Tie it into your broader network monitoring setup and the daily glance becomes a habit.
Metadata logging: Zeek
When you want more than flow summaries but less than full packets, Zeek (formerly Bro) is the tool. Zeek doesn’t hunt signatures — it watches traffic and writes structured logs of every connection, DNS query, TLS handshake, HTTP request, and certificate it sees. The result is a rich, queryable record of what happened on your network, which is gold for forensics: when something looks wrong, Zeek’s logs let you reconstruct exactly what a device did and when.
| Approach | What you get | Cost/overhead | Home use |
|---|---|---|---|
| Flow (NetFlow/ntopng) | Conversation summaries, top talkers | Very low | Default baseline layer |
| Zeek metadata logs | Structured per-connection records | Moderate (CPU, storage) | Forensics, deeper baseline |
| Full packet capture (pcap) | Every byte, replayable | High (storage especially) | Targeted, short-term only |
| Signature IDS (Suricata) | Named alerts on known-bad | Moderate | Alerting, runs alongside |
Zeek is more setup than ntopng and gives you data to interpret rather than alerts to react to, so I’d add it once flow analysis feels limiting, not as a first project. It pairs naturally with a SPAN port: feed the mirror to a Zeek sensor and you get a full metadata trail of even the intra-VLAN traffic your firewall can’t see.
Full packet capture: powerful, and a storage trap
The deepest tier is full packet capture — recording every byte with tcpdump or Wireshark for replay and analysis. It’s indispensable when you’re investigating a specific problem and need to see exactly what’s in the packets. It is also a storage trap: continuously capturing a busy network fills disks fast, and most of what you capture is encrypted payload you can’t read anyway. My rule is to capture targeted and short-term — turn it on when chasing a specific question (why is this device misbehaving, what exactly did this connection carry), grab a few minutes, analyze, and turn it off. Continuous full capture is an enterprise practice with enterprise storage behind it; at home it’s a tool you reach for deliberately, not a thing you leave running.
What to actually look for in the traffic
Tools are useless without knowing what a finding looks like, so here’s what earns a second look once you have a baseline. New destinations: a device that suddenly connects somewhere it never has before, especially a foreign IP or a raw address with no hostname. Volume anomalies: a low-chatter device — a bulb, a sensor, a plug — sending far more data than its normal few kilobytes, which can mean it’s been recruited into something. Beaconing: regular, clockwork connections to the same host at a fixed interval, the classic signature of malware checking in with a command-and-control server. Unexpected protocols: a device speaking SSH, SMB, or RDP when it has no business doing so, often the first sign of lateral movement. DNS oddities: a flood of lookups for random-looking domains, which can indicate DNS tunneling or a device cycling through generated command-and-control names.
None of these require you to read encrypted payloads — they all live in the metadata, the part traffic analysis exposes even when the content is ciphertext. That’s the quiet strength of this layer: an IDS often can’t see inside a TLS session, but ntopng and Zeek can still tell you that a connection happened, how big it was, how often it repeats, and where it went. Behavior is visible even when content isn’t, and behavior is usually enough to know something is wrong. The trick is that “wrong” is defined relative to your normal, which is why the baseline comes first — you can’t recognize an anomaly on a network you’ve never characterized.
A homelab-scale approach
Here’s how the layers stack in practice, smallest effort first. The firewall exports flow data to ntopng, giving me a live baseline of top talkers and destinations across the north-south traffic — that alone catches most behavioral surprises. Suricata runs on the same firewall for signature alerts. For the east-west blind spot on the segments I care about most, a managed-switch SPAN port feeds a small sensor, and when I want a forensic trail there, Zeek logs it. Full packet capture stays in the drawer for targeted investigations. None of this is a SIEM or enterprise observability stack — it’s a handful of right-sized tools that together mean I actually know what my network is doing, which is the whole point.
The reason any of it works is segmentation. Because the hydro lab, the IOT devices, the kids’ consoles, and the lab live on separate VLANs, traffic analysis is legible — I’m not staring at one flat soup of packets, I’m looking at clearly bounded zones where “normal” for each is well defined. When the IOT segment’s baseline shifts, that’s a signal, not noise. Analysis and segmentation are the same instinct: draw the boundaries first, then you can actually see across them. Once you can see the traffic, the next skill is interpreting what the alerts and logs are telling you — that’s reading IDS logs for beginners. And if you haven’t stood up the detection layer yet, start with installing Suricata on pfSense.
Related Guides
- Home Network Intrusion Detection: The Complete Guide
- ntopng for Home Network Monitoring
- Home Network Monitoring and Observability
- Reading IDS Logs for Beginners
- Managed Switch Setup: Trunks, Tags, and VLANs
- Installing Suricata on pfSense